
On August 5 the Tour de France Femmes rode out of Mâcon, where I grew up. We recorded the live tracking feed all afternoon, then rebuilt the stage profile from the race center in R so the stage can be replayed any time.
Mâcon is where I grew up, so when the 2026 Tour de France Femmes route came out with stage 5 starting there, I paid more attention than usual. I’d watched the Tour on TV as a kid, and this time it was leaving from my hometown and going over Beaujolais climbs I know well. I followed it on and off during the afternoon on the race center. That’s the page with the stage profile, the numbered groups moving along it and the gaps between them. I wondered how much of it we could rebuild in R as a blockr block. The blocks, the widget and this post were all built by supervising Claude Code. I wrote the specs and did the reviewing, and I have a few things to say about that at the end.
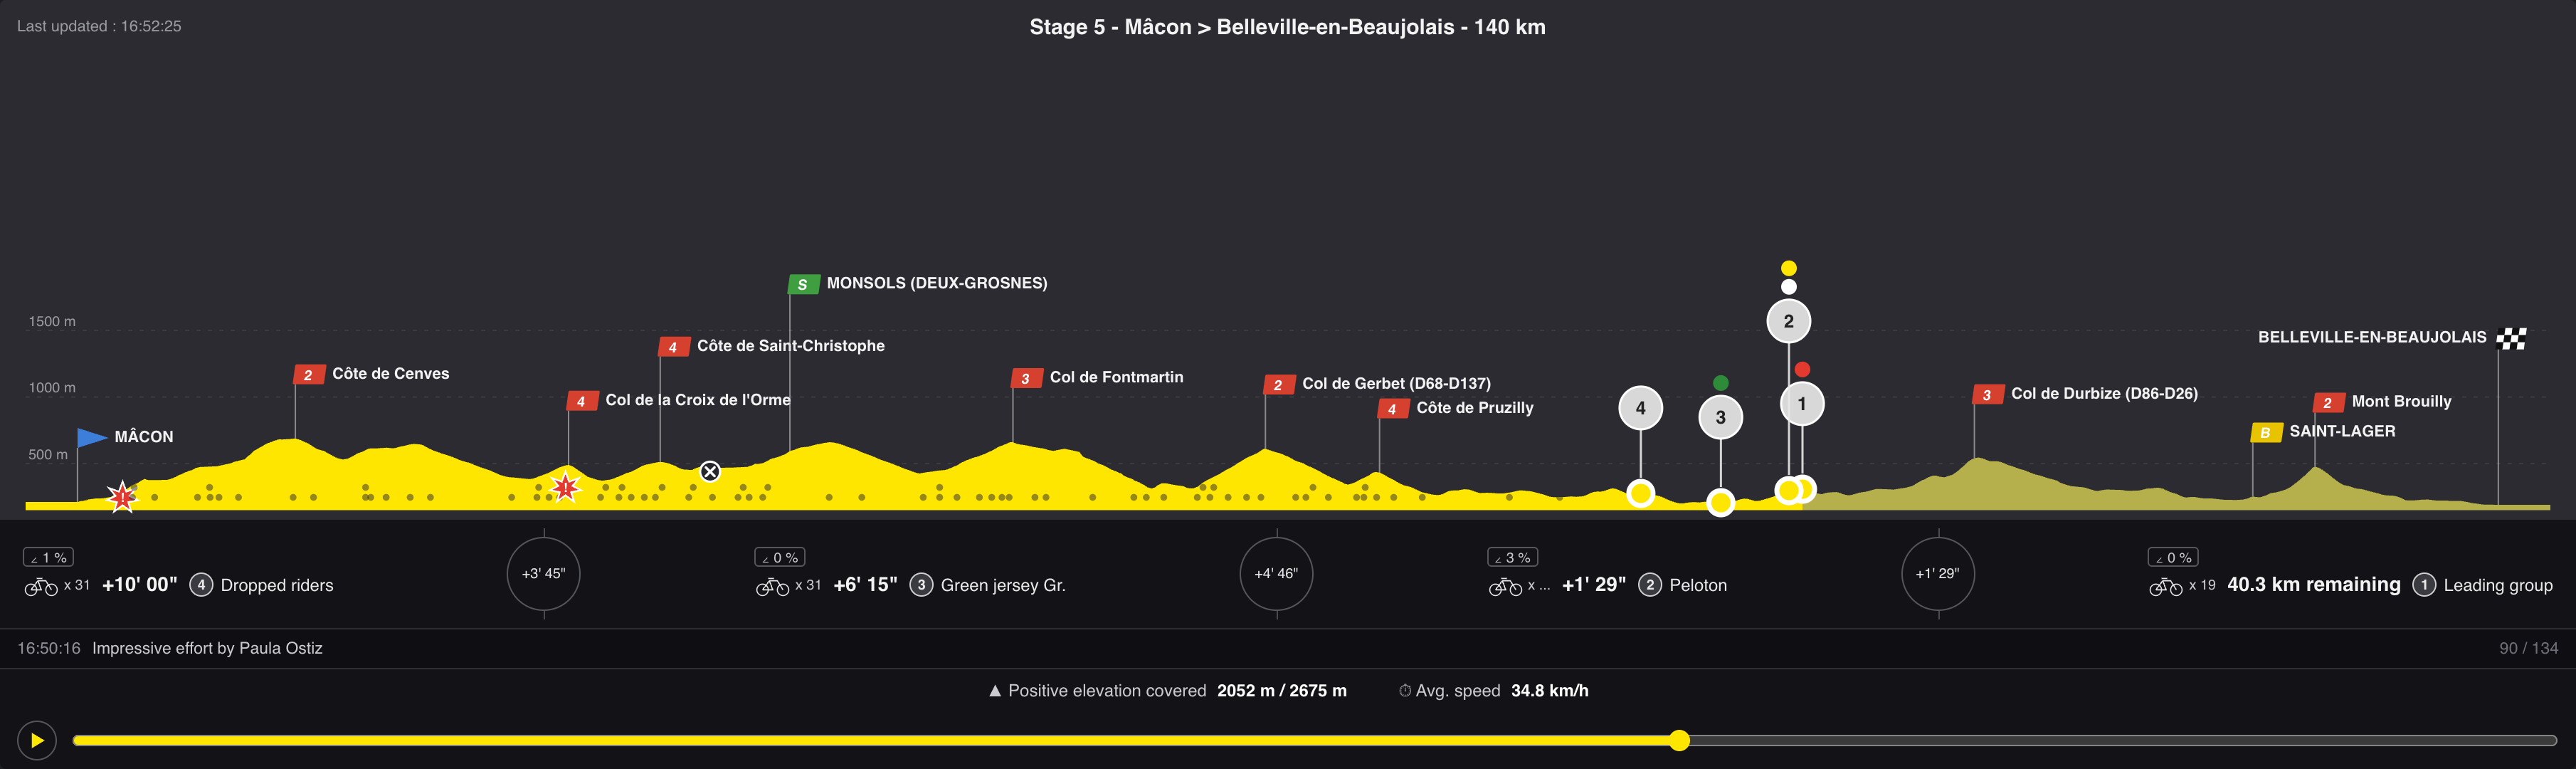
Everything below replays from a recording on disk, so you get the same race every time.
Stage 5: Mâcon to Belleville-en-Beaujolais
The stage left Mâcon on August 5 and finished 140 km later in Belleville-en-Beaujolais: eight categorised climbs and 2675 m of climbing, with no summit above 700 m. It was around 30 degrees all afternoon. Demi Vollering won, and the race split up so much on the way that at one point there were eight separate groups on the road.
How is the race tracked?
Every rider carries a small GPS transmitter on her saddle rails, which sends her position and speed about once a second, and nothing else. Power and heart rate are personal health data, so they stay private unless the rider publishes them herself. The transmitters relay for each other, and so do the television motorbikes. From there the signal goes up the same helicopter radio link as the pictures. It works everywhere except in tunnels. The groups are the platform’s guess: riders close together at a similar speed go in the same group, and that is what gets a name on screen. It works out the time gaps as well. The rest arrives in separate files: the classifications, the length and average gradient of each climb, and the weather at thirteen points along the route.
What comes out for one group looks like this, cut down to three riders out of nineteen:
{
  "date": "2026-08-05T16:31:37+02:00",
  "groups": [
    {
      "id": 1,
      "name": "Tête de la course",
      "order": 0,
      "size": 19,
      "latitude": 46.228911,
      "longitude": 4.711022,
      "speed": 28,
      "completedDistance": 87351,
      "remainingDistance": 52659,
      "relative": 0,
      "localization": "FRA|RHÔNE (69)",
      "bibs": [{ "bib": 3 }, { "bib": 6 }, { "bib": 12 }]
    }
  ]
}
order is the race order, relative is the gap in seconds, and the
distances are in metres. Each entry in bibs also carries a reference
to the rider record, which is where the names and the teams come from.
Record the stage live
First I wanted to know where the page gets its data. The race center is a Vue app, so I read its JavaScript bundle and found the endpoint names. You don’t need a key for any of them. Be careful though: after the stage, the endpoint with the groups in it only keeps the last snapshot and drops everything before it. We saw the same on an earlier stage and across the whole 2025 edition. If you want the positions, you have to save them while the race is on. On August 5 we sat there with a script running, asking the endpoint every 30 seconds and saving a file whenever the timestamp had changed. By the finish we had 526 snapshots, from 14:00 to 18:25, plus the rider list, the climbs and the classifications.
Rebuild the route
The feed only gives distances, so the profile had to come from somewhere else. Our first try drew a line between the official checkpoints and read elevations along it. The road bends around the hills, while a straight line between two checkpoints goes straight over them, so those elevations were wrong. The recording had what we needed. Every group position carries coordinates as well as the distance covered, so the riders had already measured the road for us, about every 30 m. Elevations taken from those points put the summits within a few metres of the official altitudes.
Build the blocks
blockr is a no-code framework for R. You connect blocks on a board and each one does a single step. If the block you need does not exist, you write it. We wrote five for this stage.
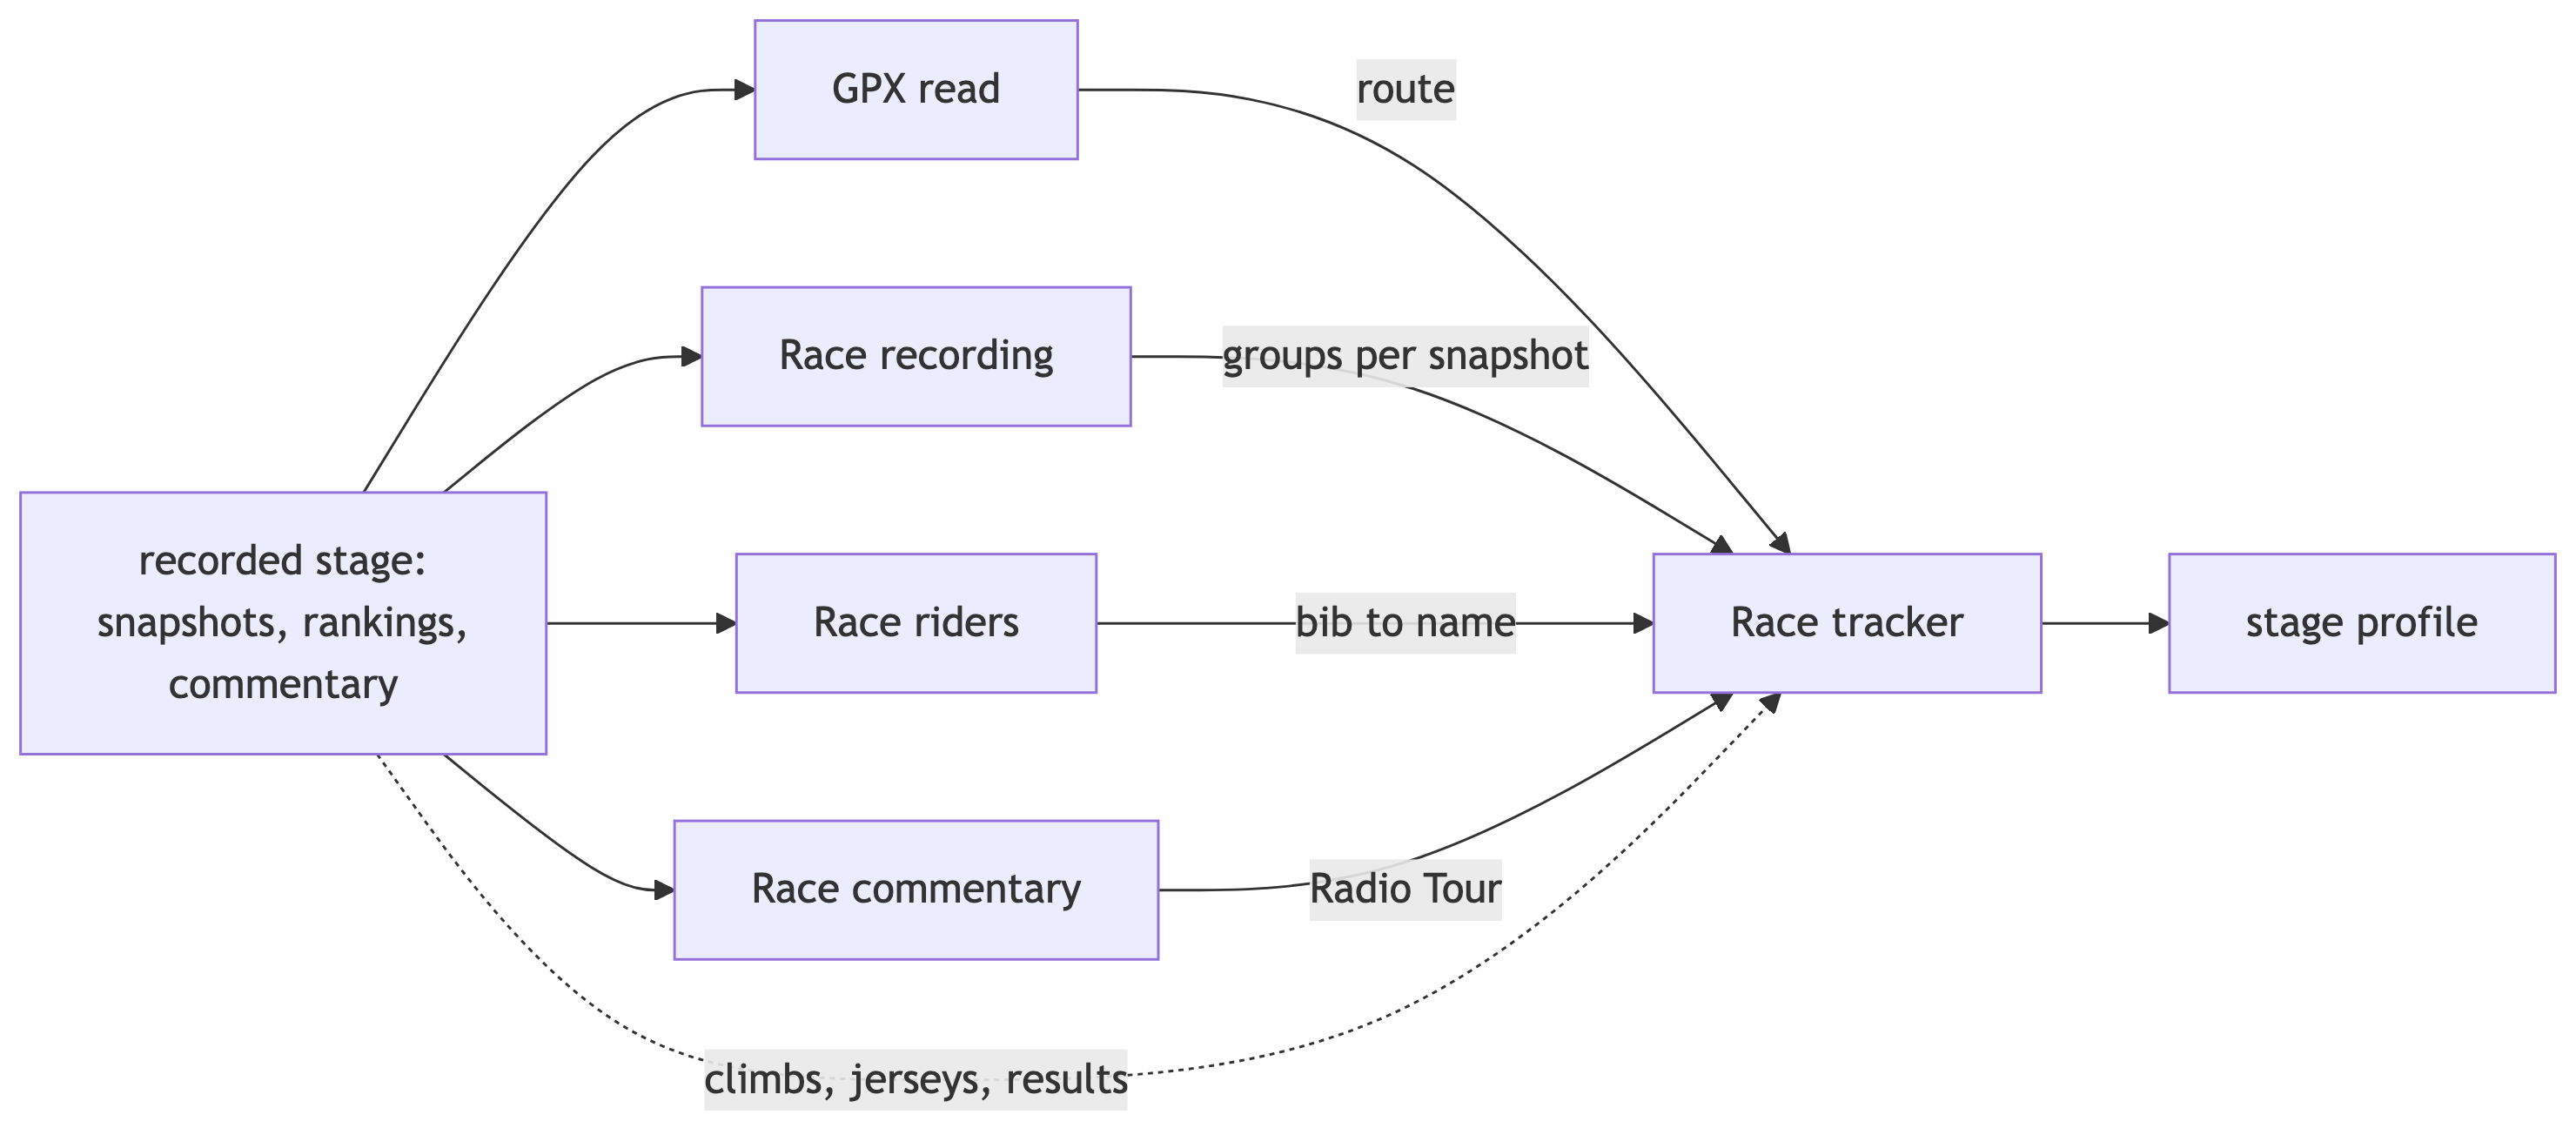
The four readers are simple:
- GPX read turns the route file into coordinates and altitudes.
- Race recording flattens the snapshots into one row per group per snapshot.
- Race riders turns bib numbers into names and teams.
- Race commentary picks the Radio Tour reports out of the recording.
The tracker draws the profile and moves the groups along it. The browser gets the whole recording at once, so it plays without waiting for the server.
Late on there were eight groups on the road, all squeezed into a couple of centimetres of axis, so we made the profile zoomable by dragging across it. On the Mont Brouilly, the last climb, Vollering, Niewiadoma-Phinney and Reusser went over the summit with five groups strung out behind them.
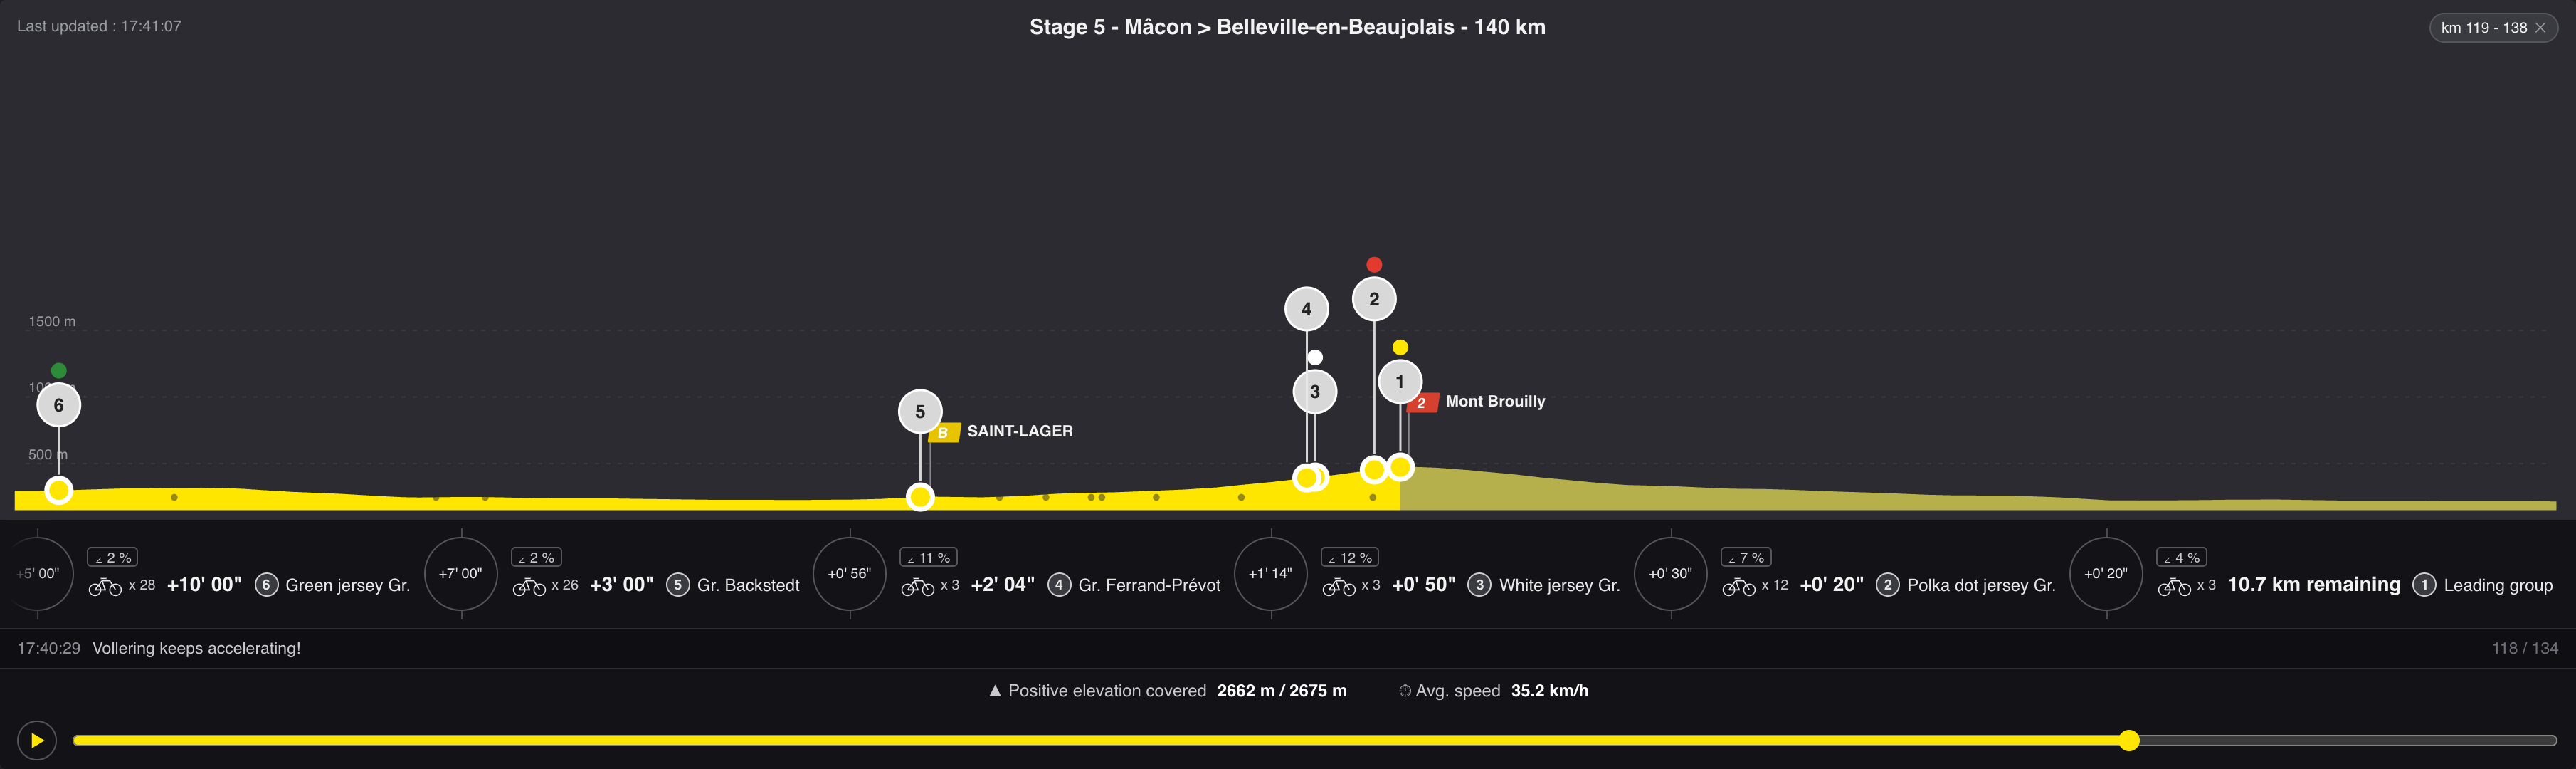
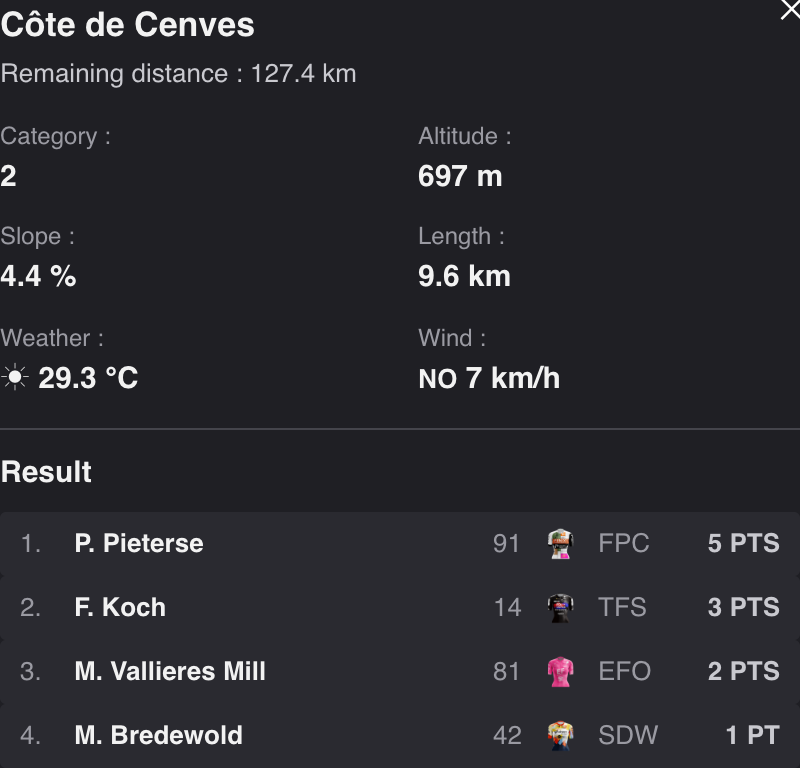
Everything on the profile is clickable. A climb shows its category, altitude, length and average gradient, plus the weather from the nearest point where the platform reports it. Once the race is past the summit it also shows who got there first. A group shows the riders in it, with bibs, teams and how far behind they are. The coloured dots above a bubble are the jerseys riding in that group.
What about crashes and abandons?
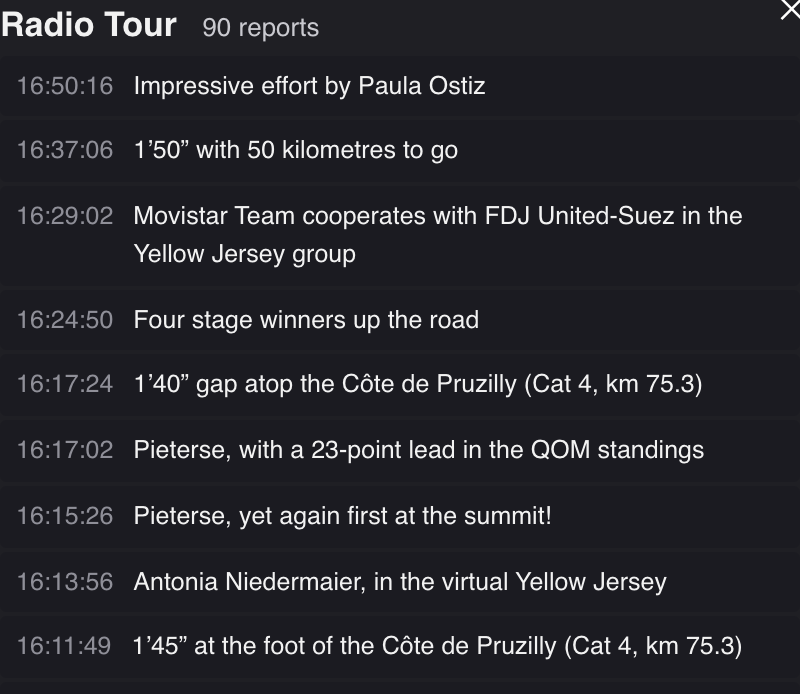
There were two crashes on this stage and one rider abandoned, and none of it is visible in the position data. A rider who went down is still listed in her group on 525 of the 526 snapshots. The only place any of it gets reported is the Radio Tour, the commentary the race center publishes alongside the tracking. We had recorded that too, without planning to use it. The reports are now a row of small dots under the profile, one per report, and each one appears as the replay reaches it. Crashes get a red star, and the rider who abandoned gets a cross where the tracker last saw her. The line at the bottom follows the replay, and clicking it opens everything published so far.
Run it in a blockr app
It is an ordinary block, so it drops into a dock board next to the workflow graph. The one below uses blockr.dock for the panels and blockr.dag for the graph.
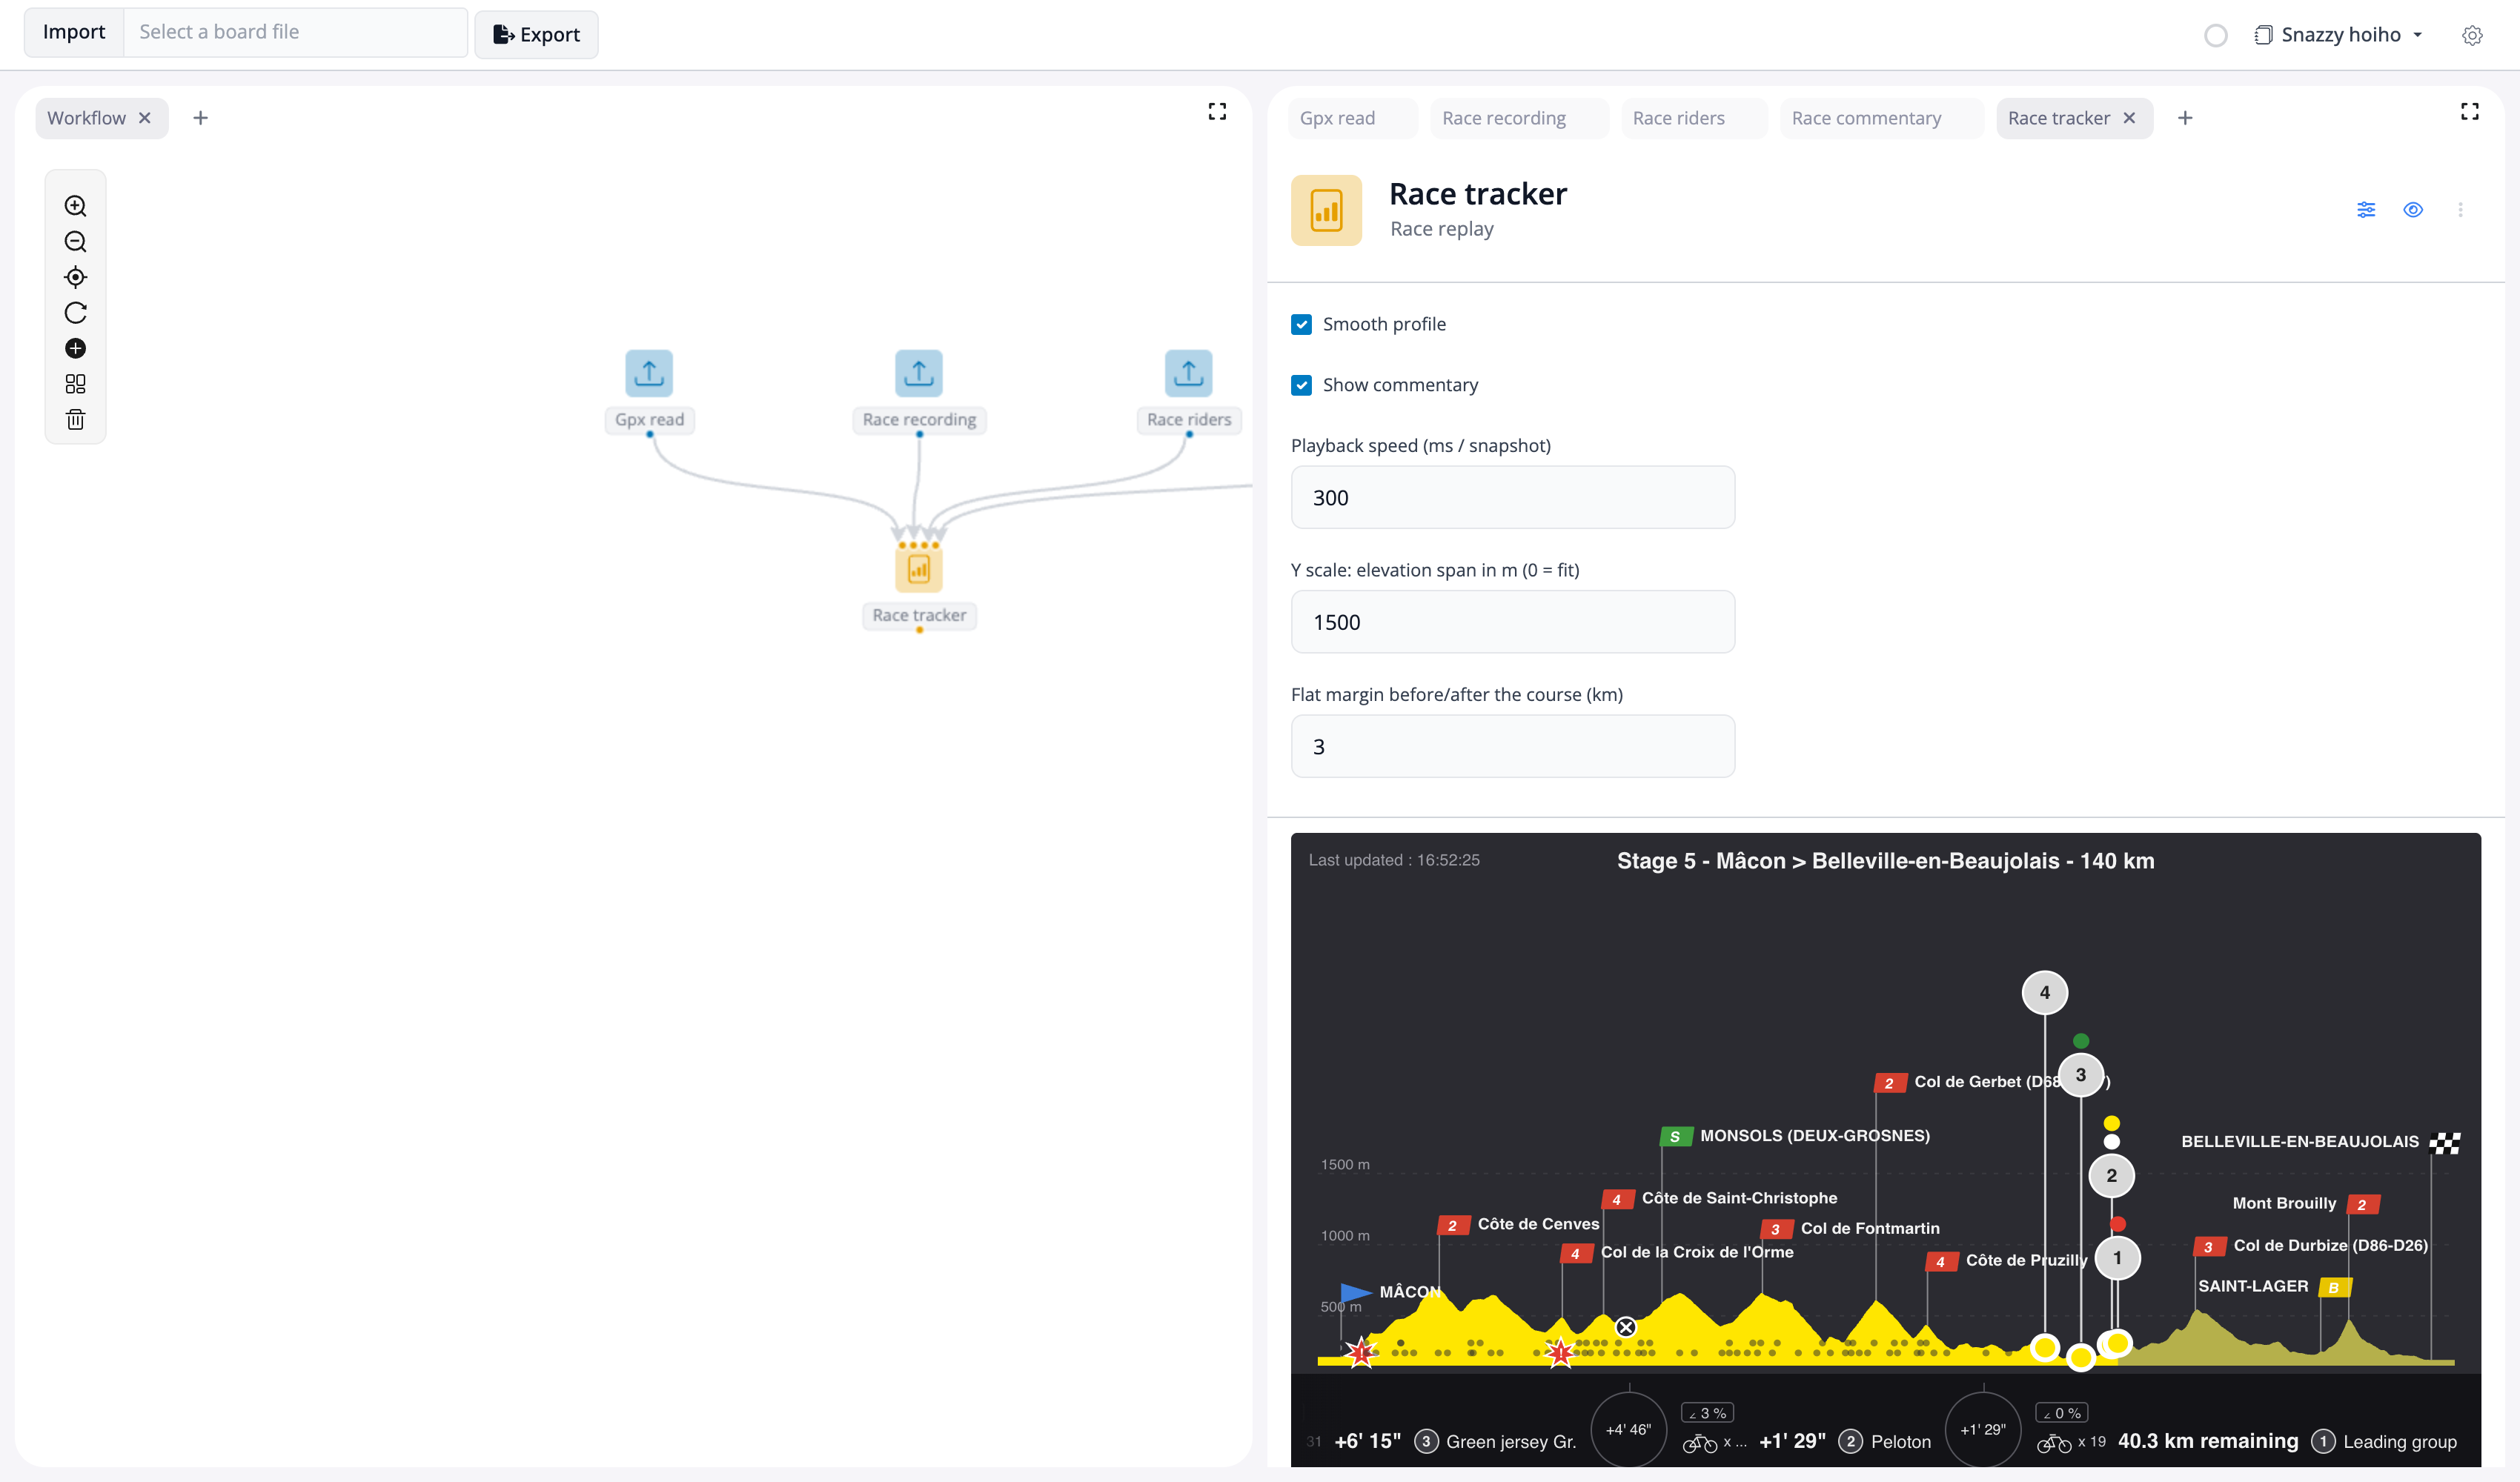
If you have never run a blockr app, two commands give you an empty one to play with:
pak::pak("BristolMyersSquibb/blockr")
blockr::run_app()
Ours runs at https://blockr.cloud/app/tdff-stage5 if you would rather watch the stage than install anything.
Ask the board questions
A second version has blockr.assistant next to the replay, at https://blockr.cloud/app/tdff-stage5-assistant.
I asked it who won and who did not finish. It read the classification files and got both right, and it says which file each answer came from.
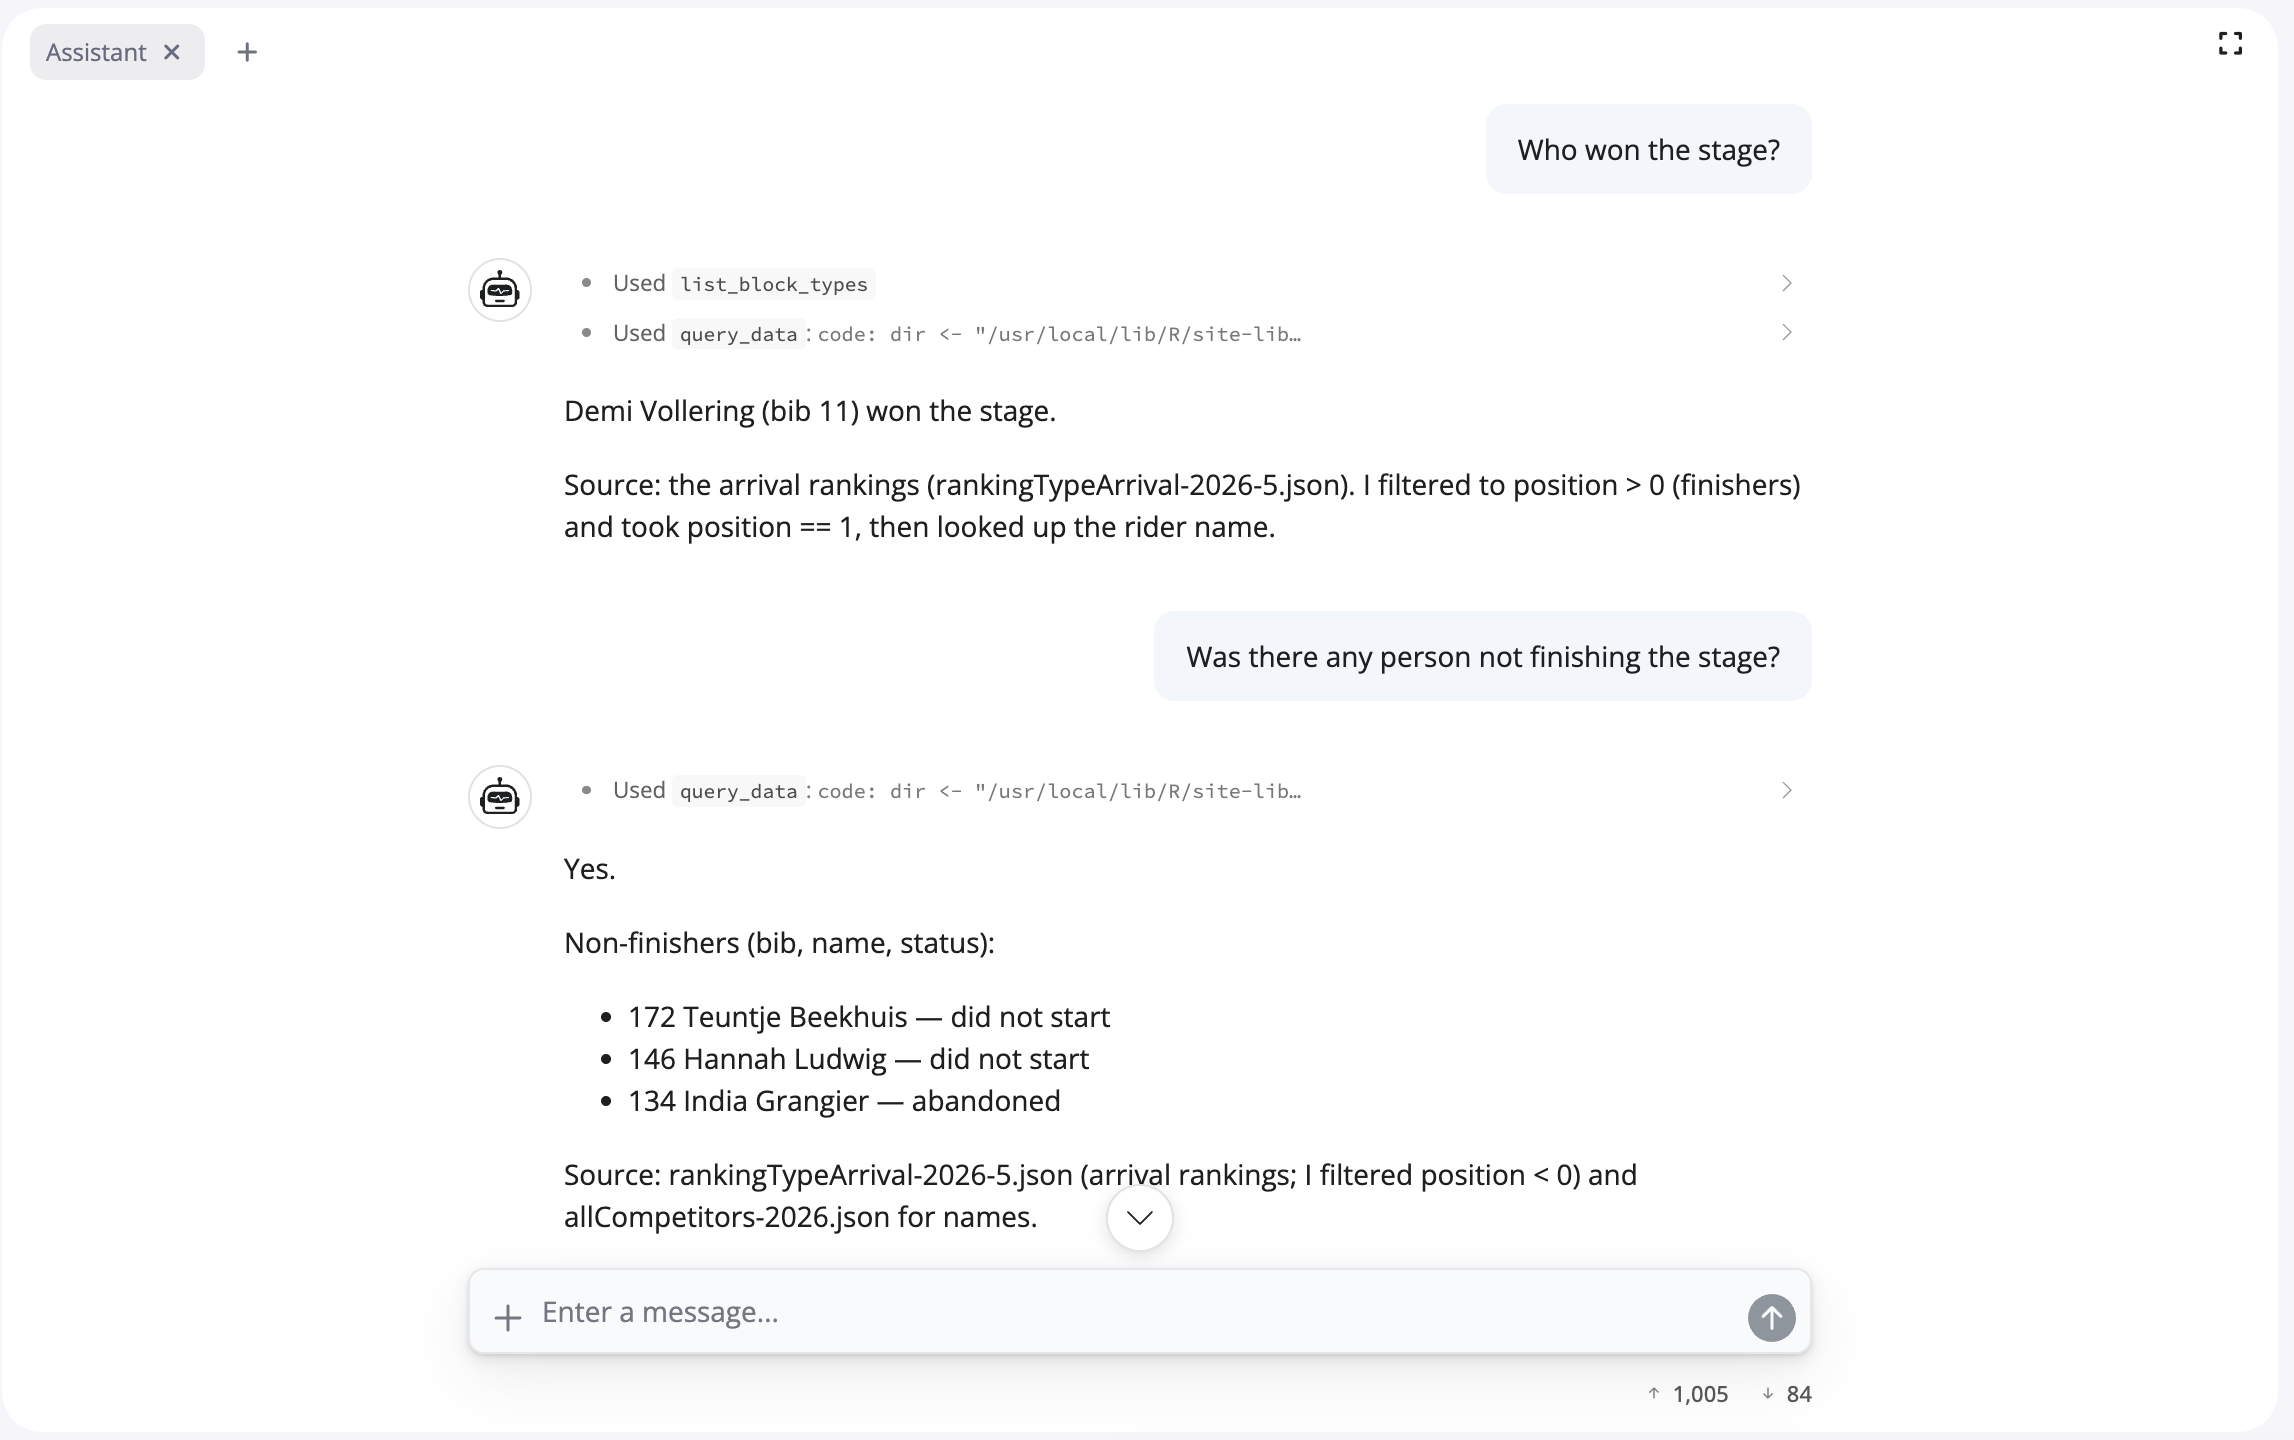
Simple questions like those come back in seconds. Ones that need the commentary take much longer, and the panels shuffle about while it thinks. The chat also has a daily spending cap and can go quiet, though the replay carries on without it.
Workshops with Athlyticz
If this looks like your kind of afternoon, we’re running two workshops with Athlyticz on September 24 and October 1, 2026. We rebuild all of it from scratch, so you learn blockr by writing the blocks yourself, wiring them into a board and putting your own data behind them. Bring a laptop and some patience for messy sports data.
Conclusion
This was a lot of fun to build, and even more fun to press play and watch a stage go through my own hometown again.
The two halves of the job were nothing alike. Claude Code wrote the blocks and the widget in a few afternoons of specs and review, and most of it worked. Writing this post was much more challenging.
Its default word order is odd and the vocabulary is full of words nobody says out loud, which gives you a headache quickly. Fixing one sentence does not fix the habit either, it comes back further down the page. I tried ChatGPT and Gemini as well and got the same thing. So if you want plain English out of any of them, plan on reading every line yourself.
Next steps
If you have feedback, reach out via the contact page on this site.